Slash Truck Rotation Time by 35%: A Dashboard Success Story
Dashboard for fleet ops — slashed truck rotation time by 35%.
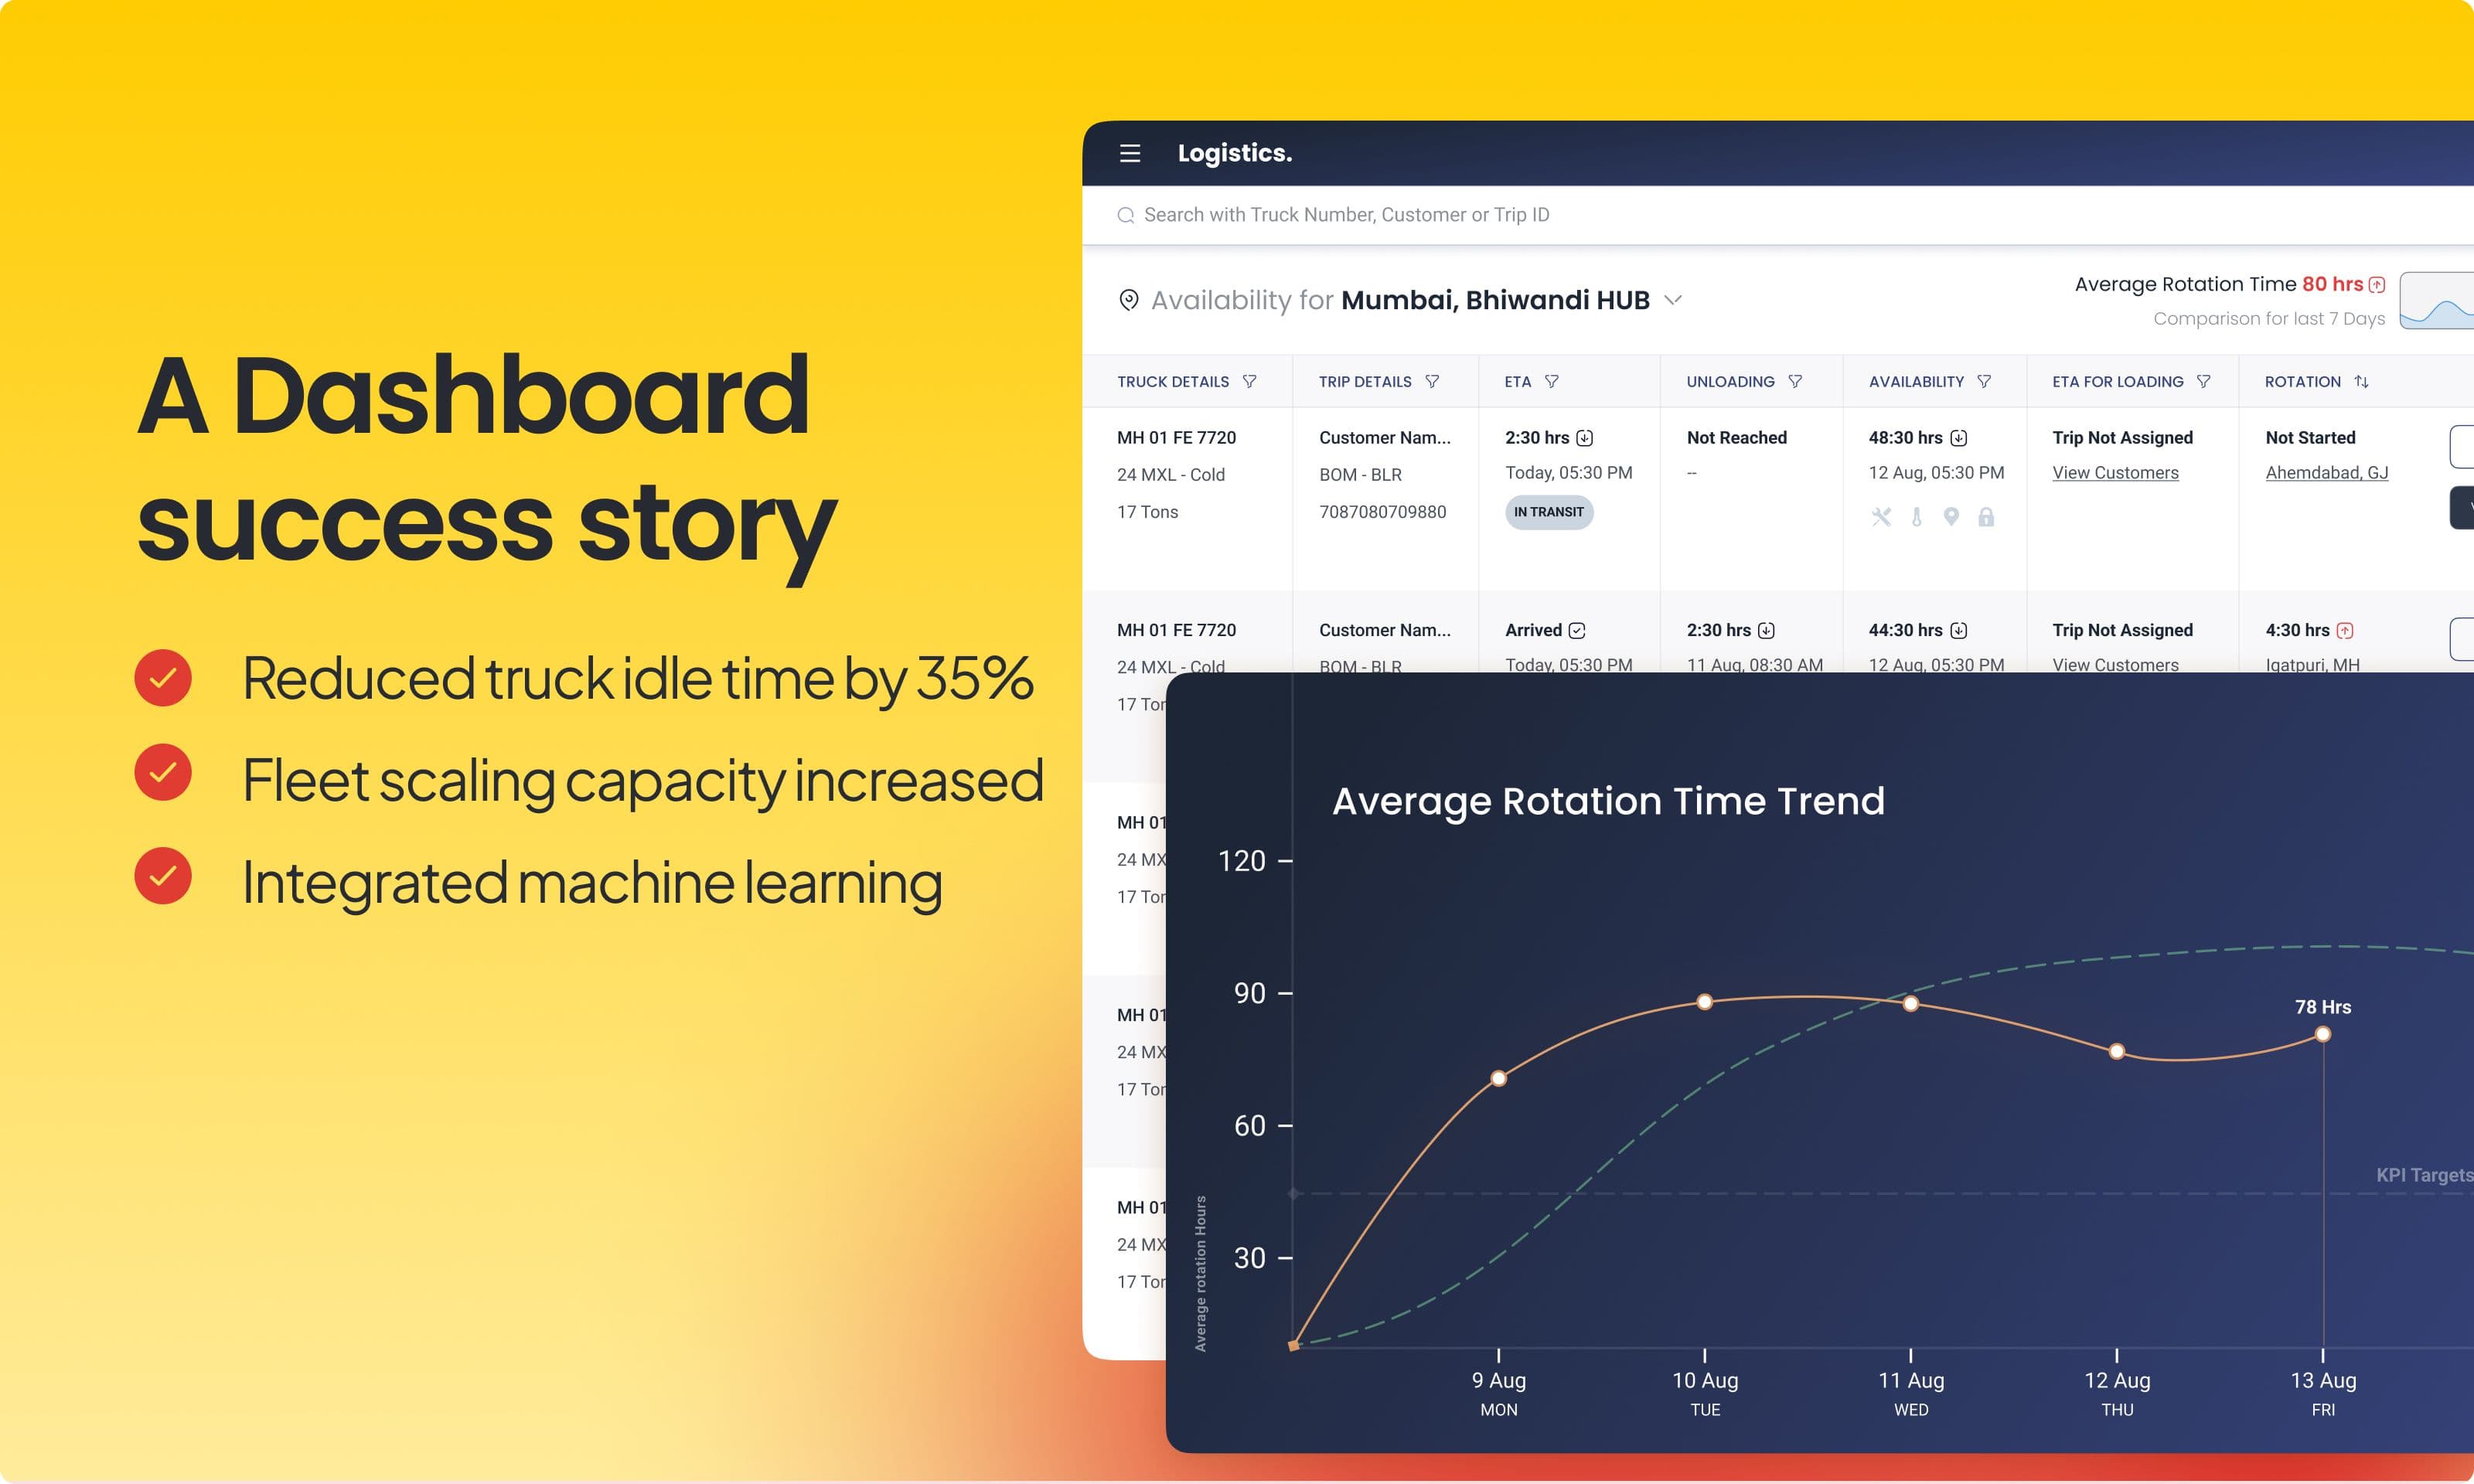
This dashboard project delivered game-changing results for a trucking logistics operation, reducing rotation time from 85 hours to just 55 hours. By digitising processes, enabling scalability, and pinpointing inefficiencies, the dashboard transformed fleet performance.
What is ‘Truck rotation time’? and factors that affect it.
Truck rotation is the total time it takes for a truck to complete a delivery cycle, from the final unloading at one customer to the start of loading at the next.
My role
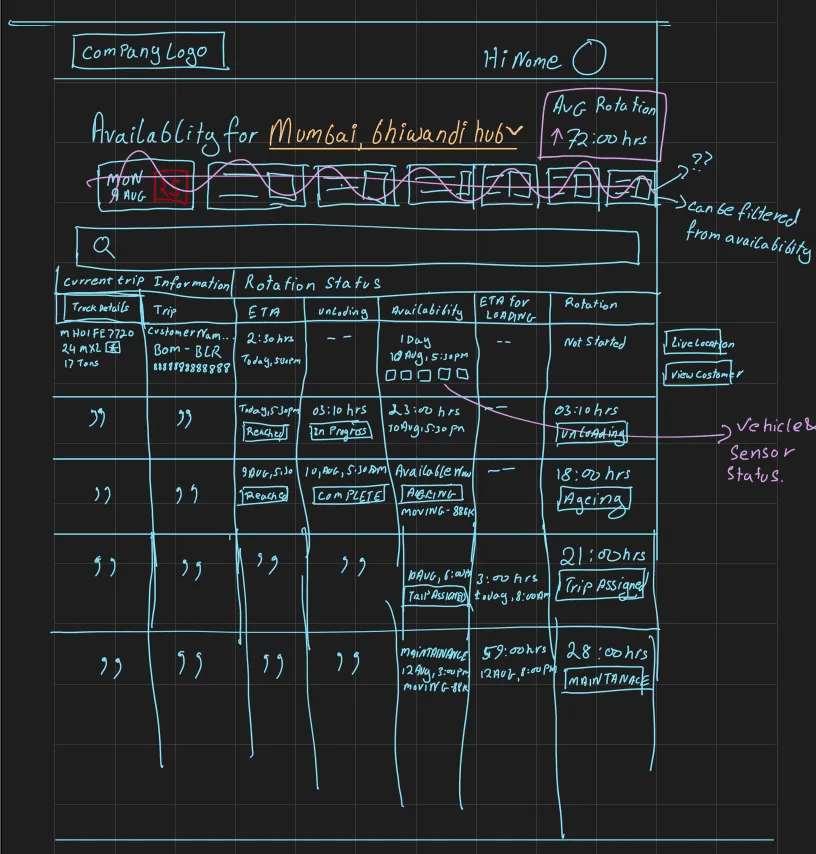
As a product designer for this project, my role was to use data-driven strategies to navigate a traditional logistics operation. I started with comprehensive research to understand the complex details of their operations. By identifying pain points caused by manual processes and limited real-time visibility, I was able to design a customised dashboard for the company.
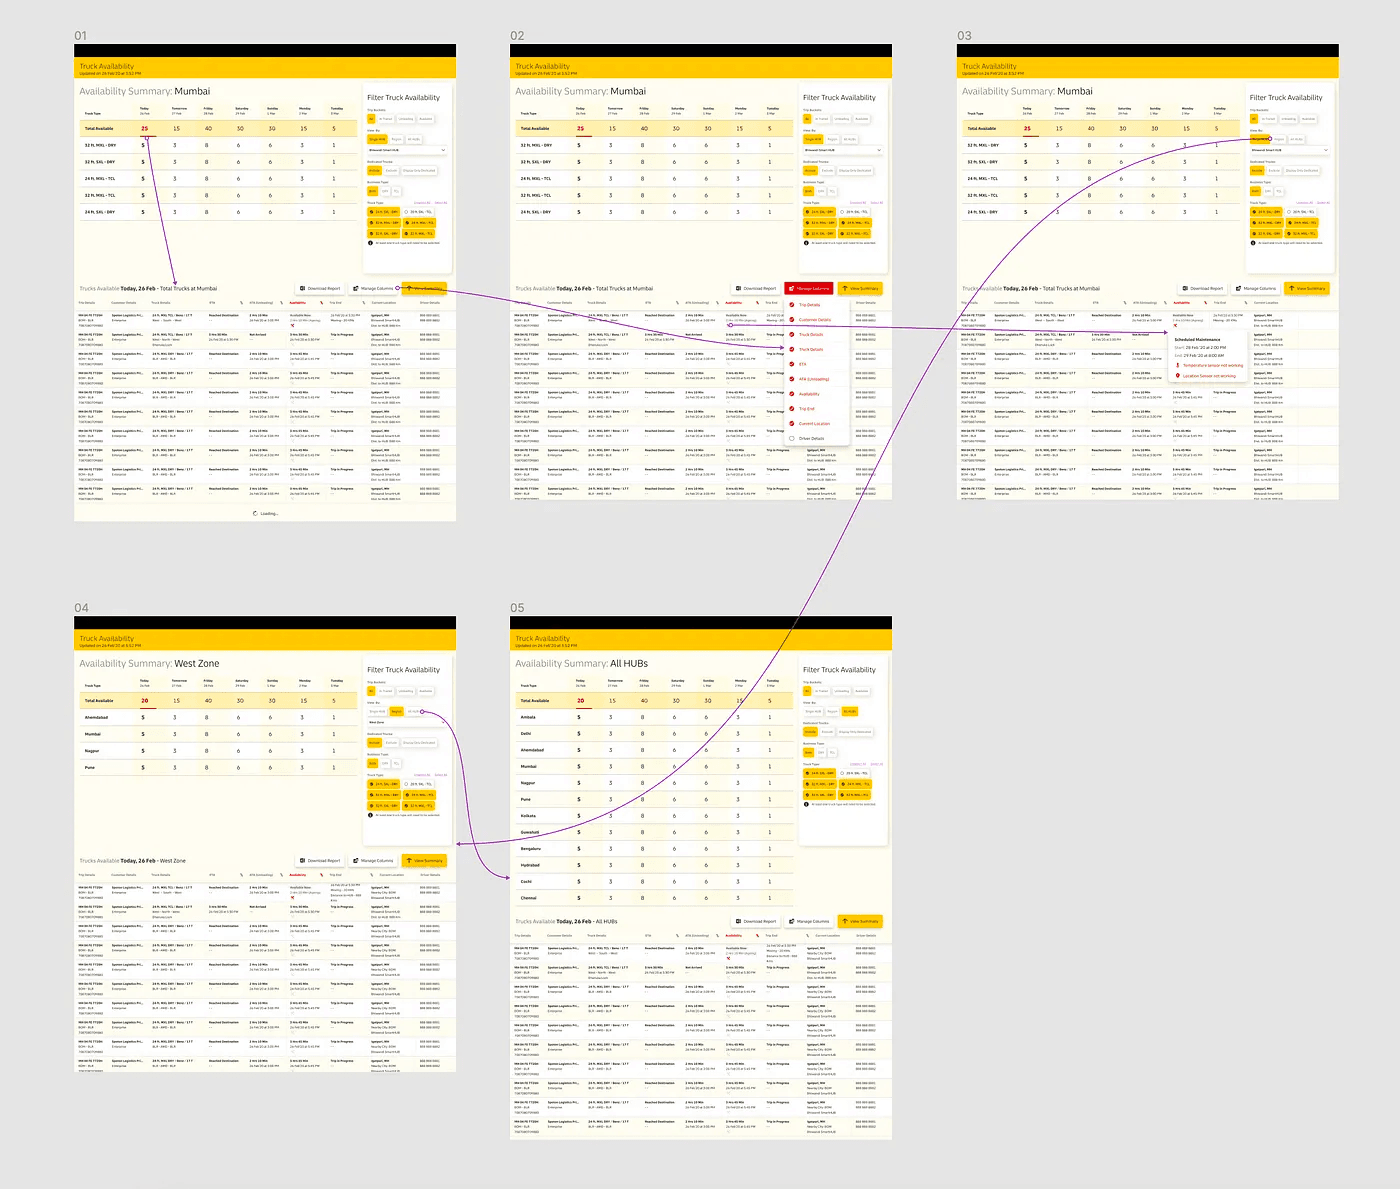
I promoted data digitisation and created a scalable system, focusing on metric-based visualisations for truck rotation time optimisation. Usability testing was later pivotal in refining the design of the dashboard.
What was done
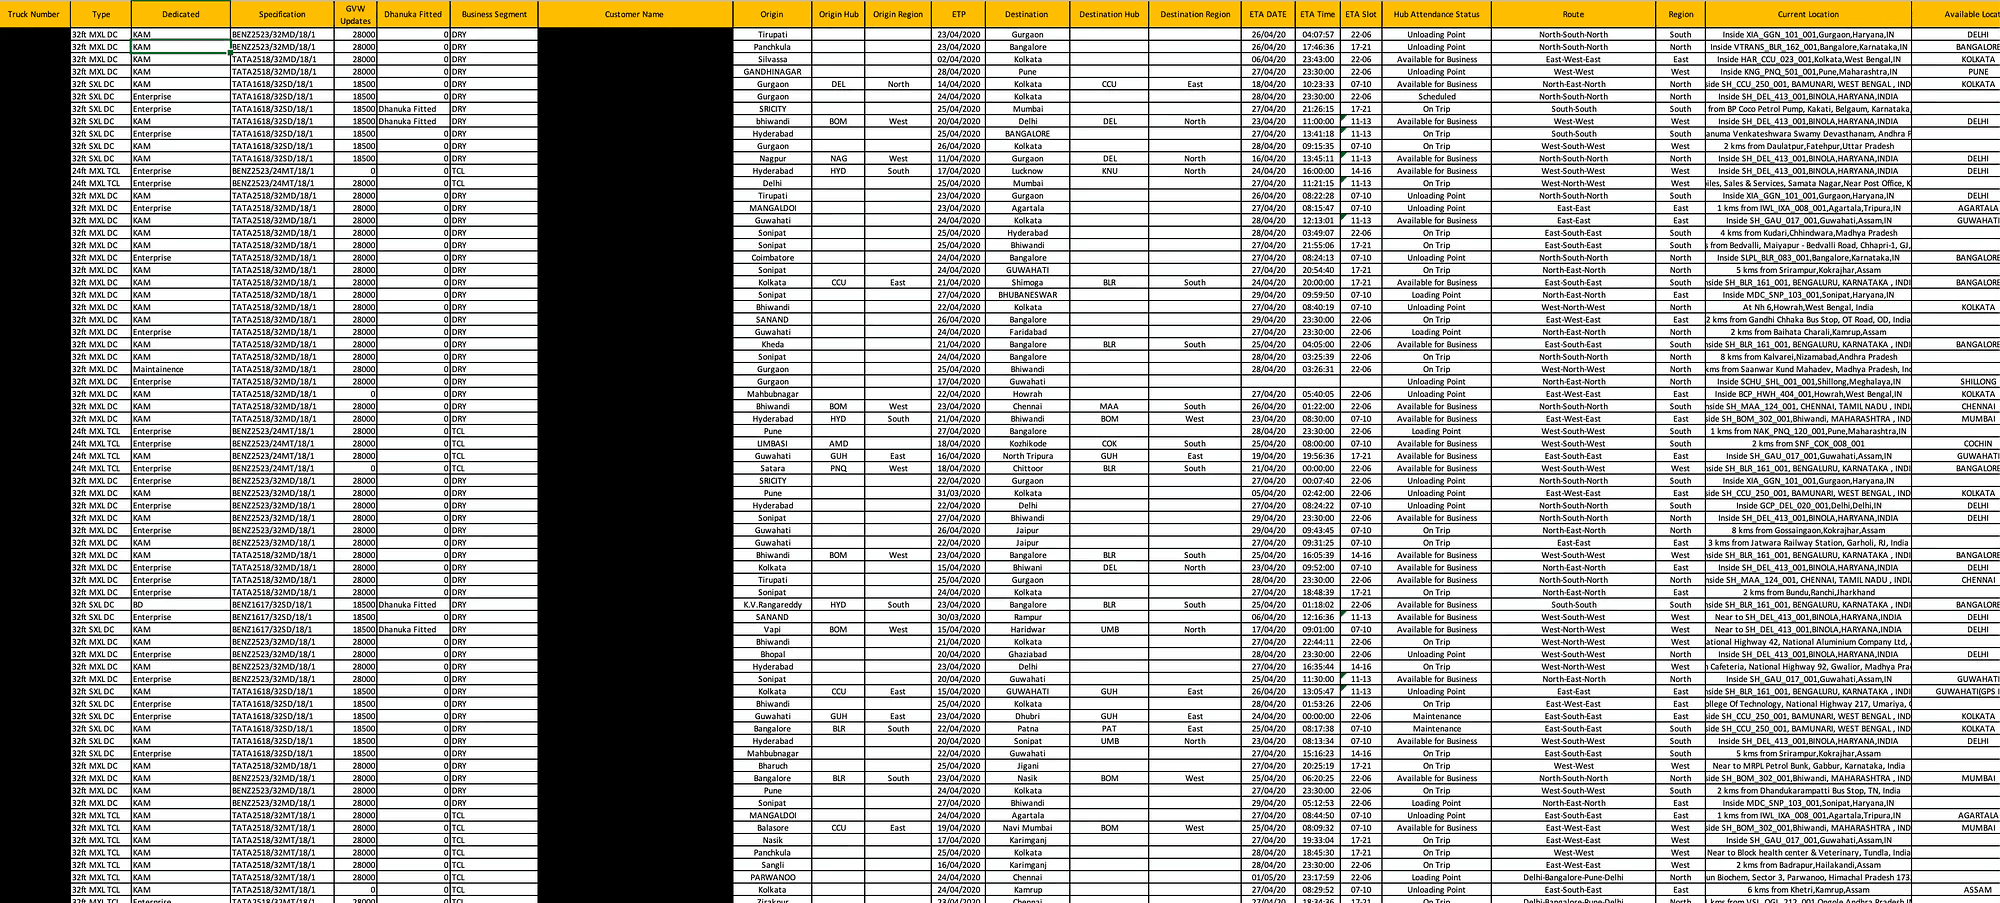
There were 2 primary business objectives that were achieved primarily being, system scalability through digitalisation and reducing ‘Rotation time of the trucks’ this directly translated into positive impact in revenue for the business. The scalability allowed the business to scale up the fleet by a 1000% at the same team strength. We were able to achieve this by gaining understanding on how the operations team used their excel sheets, and further gained actual behavioural insights through usability testing during the beta implementation.
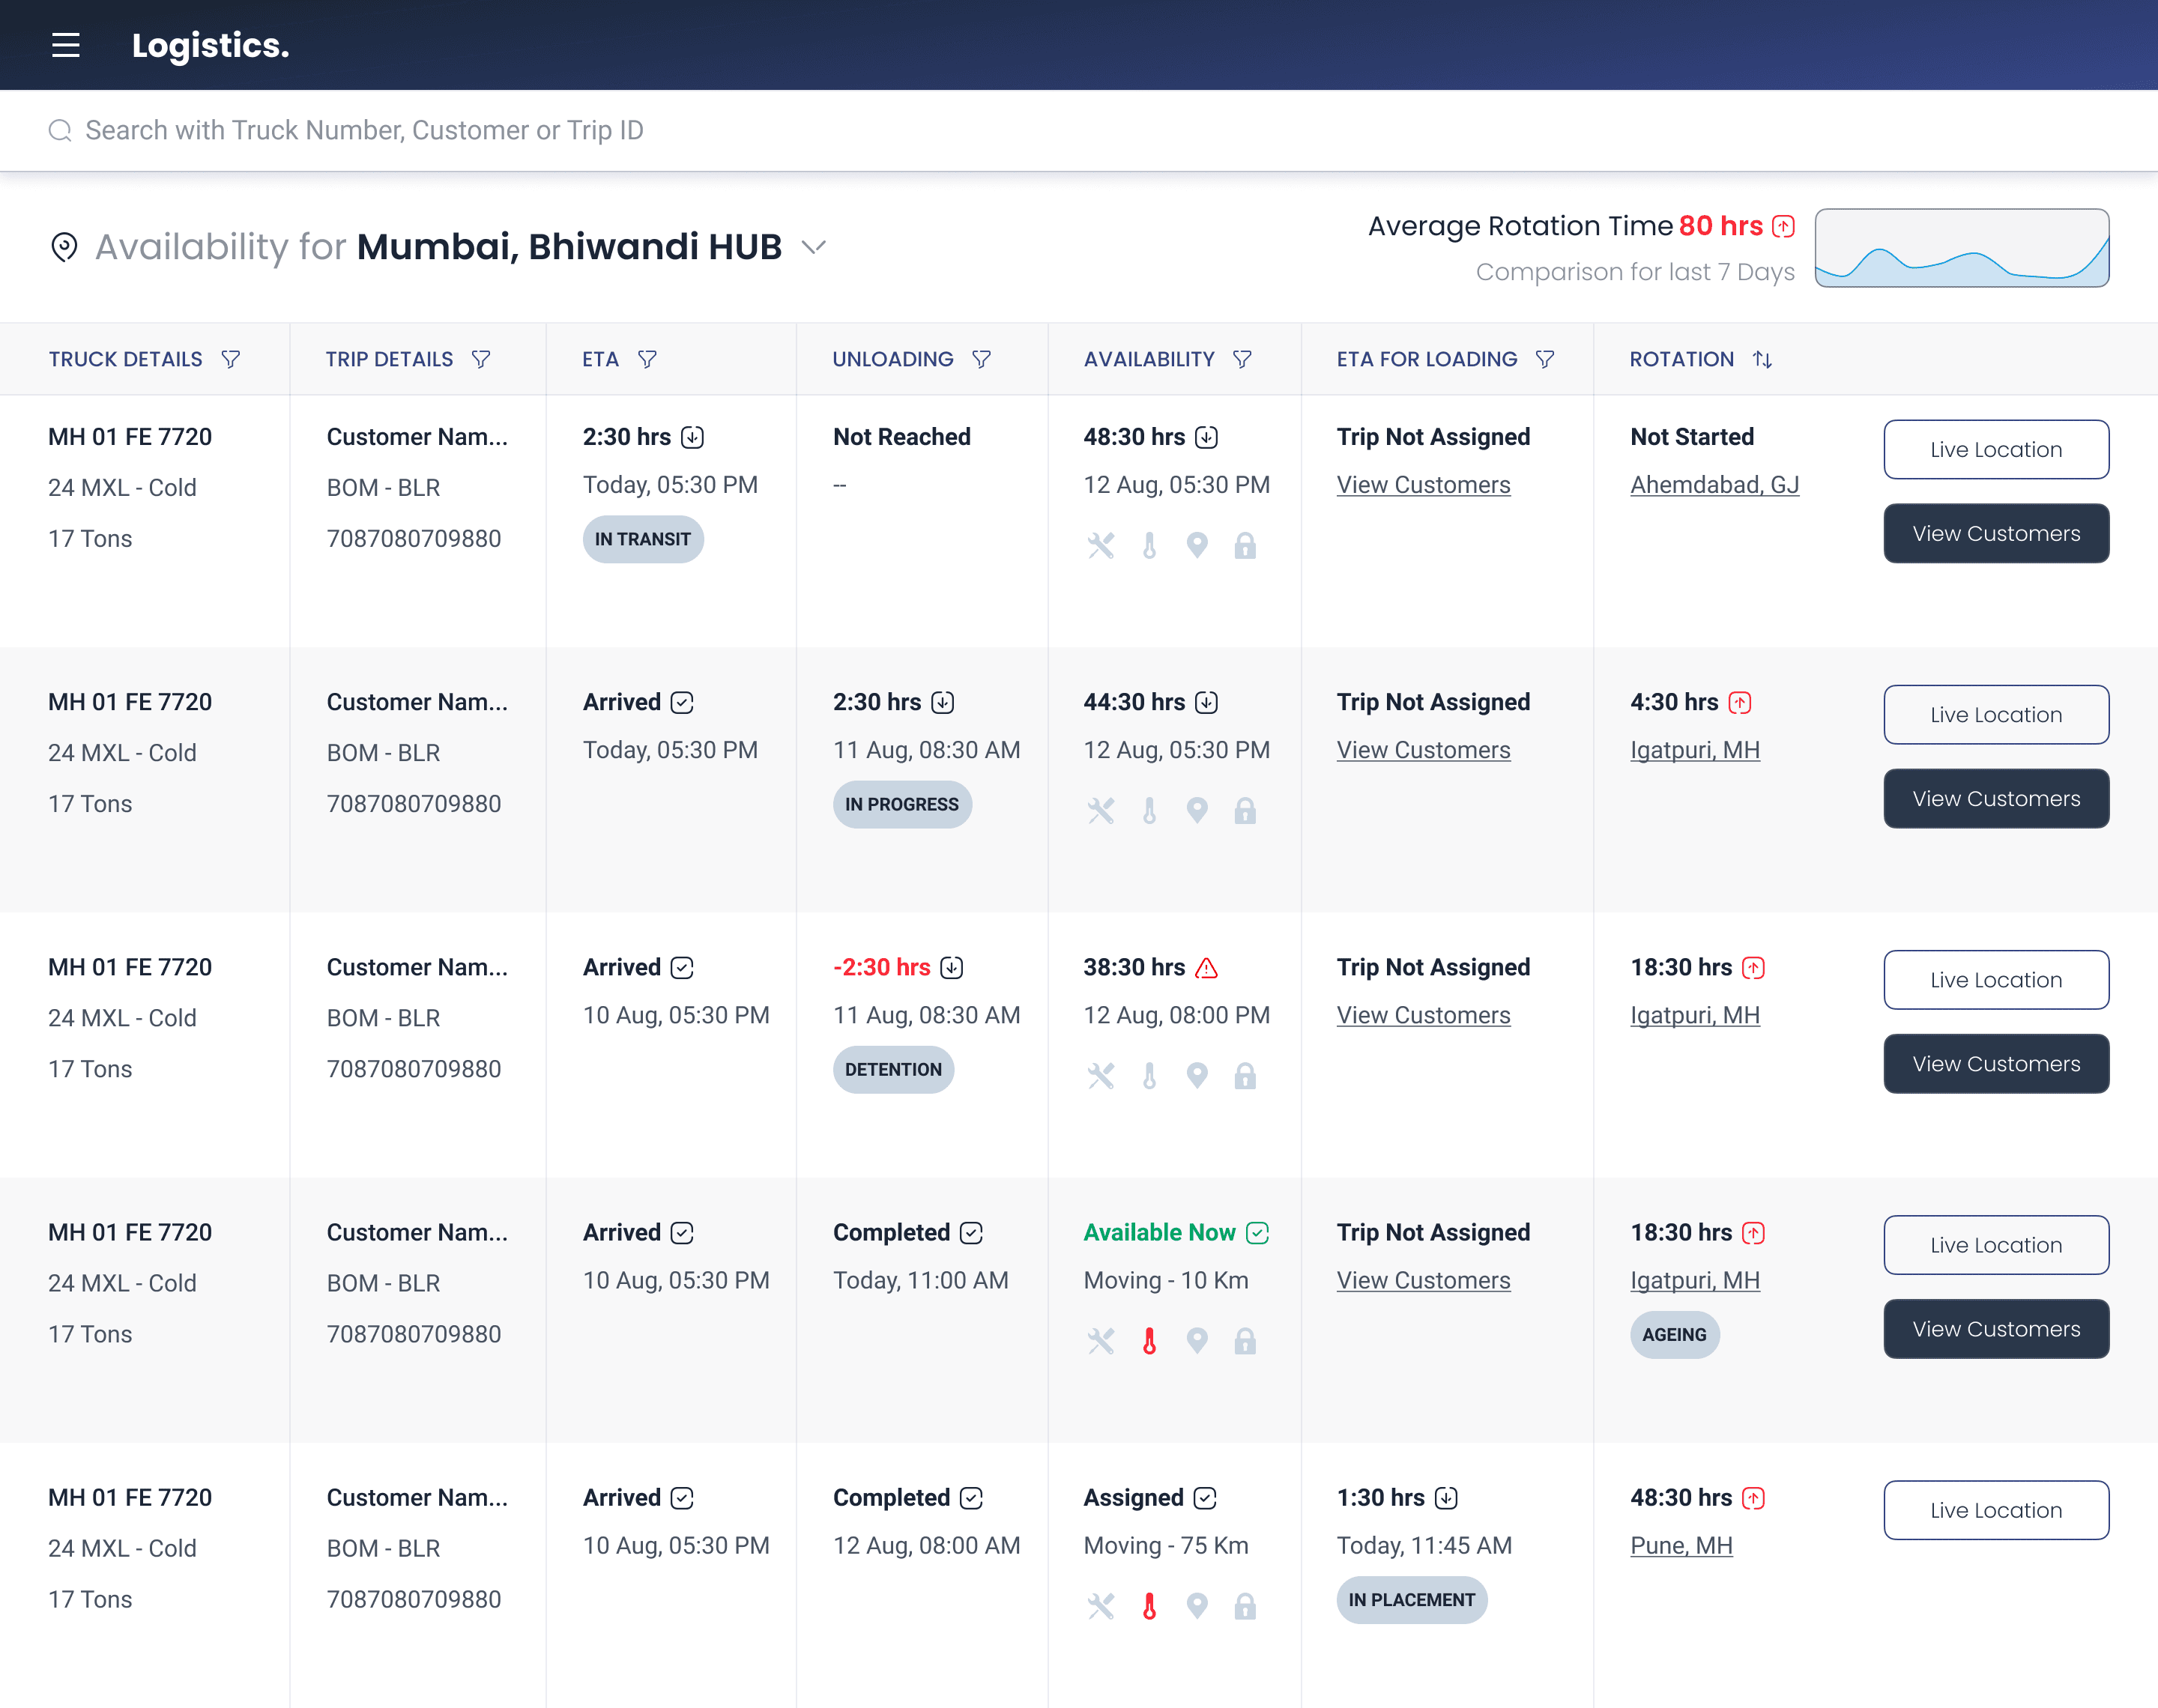
Winning user adoption, with familiar patterns
Establishing a filtering and sorting behaviour which resembled their excel sheets, this reduced the learning curve needed by the operations team in the tool adoption.
Managing alerts, improves customer experience
Providing alerts for delays, temperatures and maintenance allows the the operations to plan their vehicle availability & allotment accordingly this helps maintaining good customer experience.

Machine learning + Human Judgment = Improved route profitability
Using machine learning probabilities, we recommend customers to the order management team. This recommendation includes information such as cost margin and order placement probability. The goal is to identify more profitable routes and potential customers for advanced bookings on soon-to-be available trucks.
Eye of the tiger
A rotation dashboard that allows the teams to monitor their overall performance and it’s impact against the actual agreed upon targets.
Conclusion
This case study demonstrates the power of a well-designed dashboard to revolutionise traditional logistics operations. By digitising processes, building a scalable system, and focusing on key metrics like truck rotation time, the company achieved a remarkable 35% reduction in rotation time (from 85 hours to 55 hours). This directly translated into improved revenue for the business and enhanced customer experiences. This project proves the significant impact that data-driven insights and user centred design can have on operational efficiency and profitability.